Every hotel in your group. One view.
Scores, spend and priorities for each hotel, side by side, added up in one currency.
- Harbour Hotel78USD
- Beach Resort71EUR
- Airport Hotel64USD
- Old Town Hotel58GBP
- Lakeside LodgeUnknownUSD
All hotels
Score68
Technology spend$4.93M
4 of 5 scored
Ranked against the group
Every hotel scored the same way. No numbers means Unknown, never zero.
Group average 68
Harbour Hotel78+10
Beach Resort71+3
Airport Hotel64-4
Old Town Hotel58-10
Lakeside LodgeUnknown, not counted
One total, one currency
Converted at a dated rate. A missing rate means no total, never a guess.
- USD$2.80M$2.80M
- EUR€1.10M$1.19M
- GBP£740K$940K
Group total$4.93MRates as of Nov 1, 2026
One standard, every hotel
Written once, sent to the group’s other hotels, every version kept.
Guest Wi-Fi standardVersion 3 · Harbour Hotel
- Beach ResortReceived
- Airport HotelReceived
- Old Town HotelReceived
- Lakeside LodgeReceived
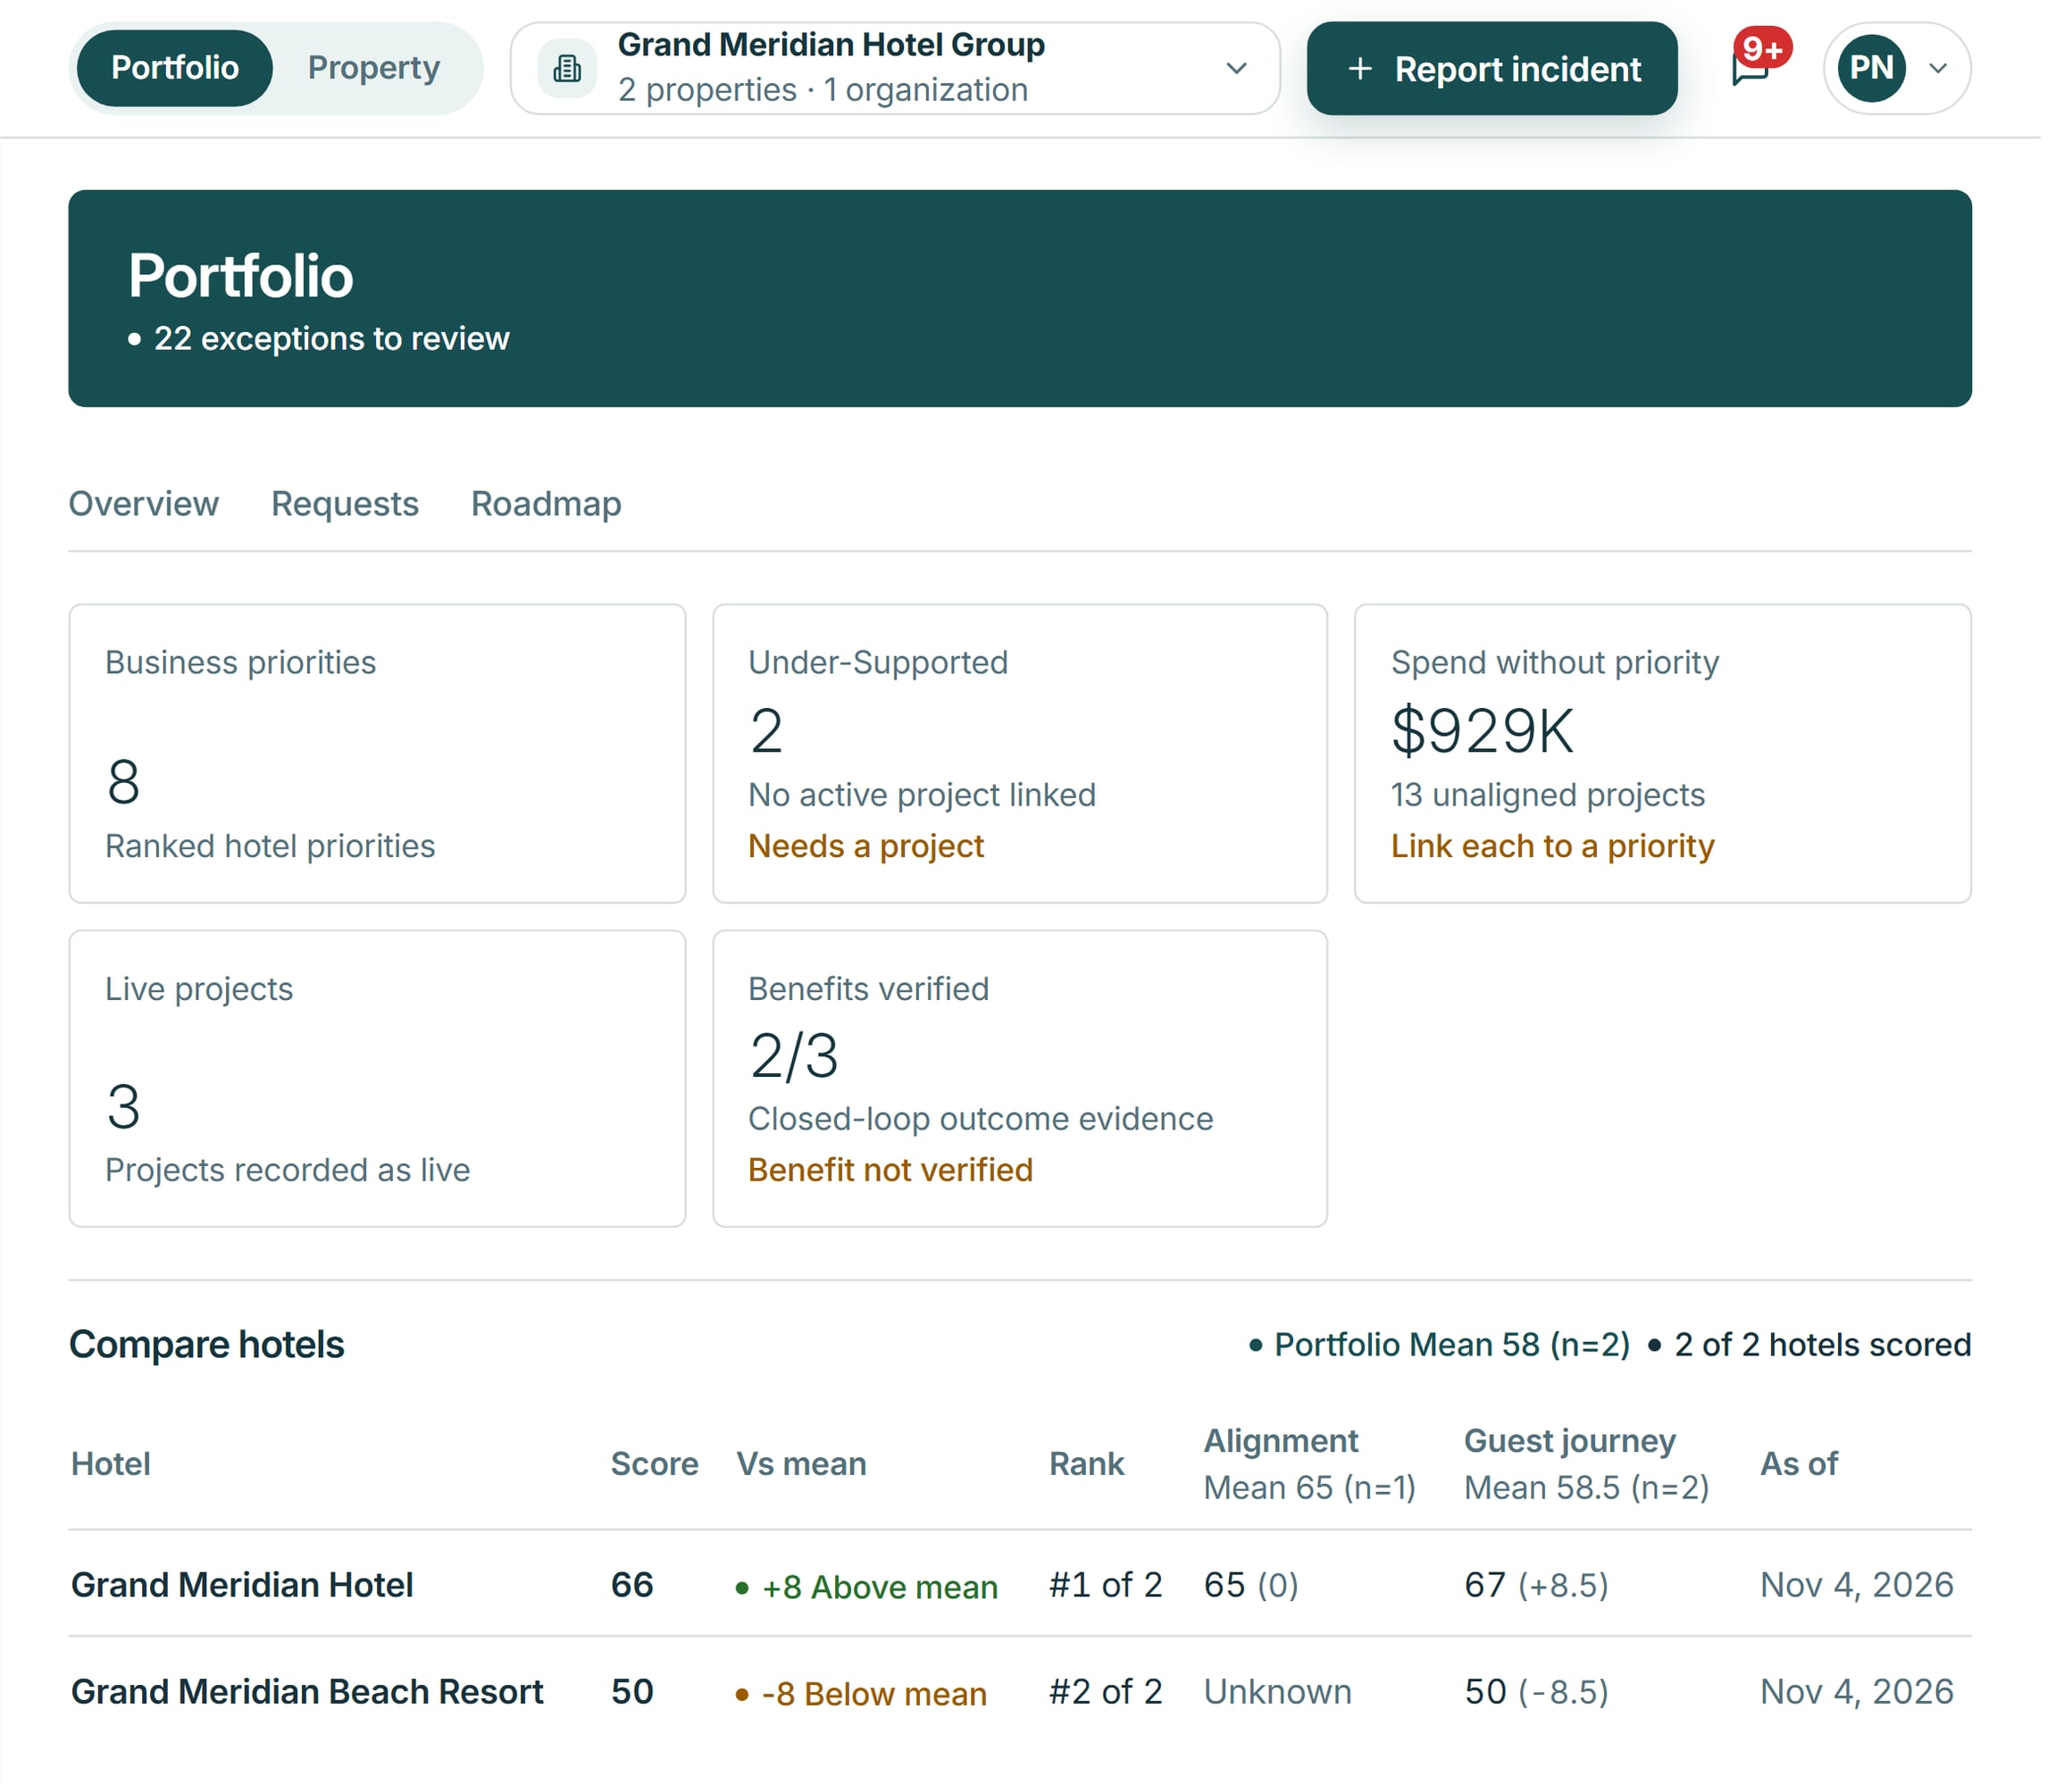
What your regional director opens
The hotels side by side, ranked against the group, with the date each was measured.
- One sign-in for every hotel
- Portfolio reports, saved as PDF
- Roll-ups by region and level
Keyline points to where the group should act first
From each hotel’s own information, with the evidence beside it. A person decides.